Advanced QEMU Debugging - Trace Events
QEMU
I enjoy working on operating system kernels and hypervisors, and for a lot of my personal work I use QEMU to help with my development and debugging. Here I’ll demonstrate an advanced debugging feature in QEMU I’ve found quite useful called “trace events”.
QEMU has a list of supported “trace events” to get more insight into the running guest OS. You can specify multiple trace commands
by adding -d trace:<name> to the QEMU command line. For example, tracing PCI configuration reads can be done with qemu-system-x86_64 -d trace:pci_cfg_read.
The full list of trace events can be found here.
Keyboard
When developing a keyboard driver, QEMU’s ps2 keycode trace event is helpful to dump the keycodes out as they are pressed. The log formatting is ps2_put_keycode(void *opaque, int keycode) "%p keycode %d" (source) and the trace flag is ps2_put_keycode.
Pressing g on the keyboard inside the guest OS generates the following trace:
ps2_put_keycode 0x55e759f09cf0 keycode 0x34
ps2_put_keycode 0x55e759f09cf0 keycode 0xf0
ps2_put_keycode 0x55e759f09cf0 keycode 0x34
Neat!
PCI Device Read/Writes
Additionally, QEMU allows you to debug some activity on the PCI bus, such as reading configuration information, with the pci_cfg_read trace flag. I used this to test
my OS code for enumerating devices on the PCI bus which works by walking the bus/device/function combinations and issuing x86 port commands.
#define PCI_CONFIG_ADDR_PORT 0xCF8
#define PCI_CONFIG_DATA_PORT 0xCFC
uint32_t pci_read_config_word(uint8_t bus, uint8_t device,
    uint8_t function, uint8_t reg) {

    uint32_t addr = (uint32_t)0x80000000 | (uint32_t)(bus << 16)
    | (device << 11) | (function << 8) | reg;

    // Use port I/O to get PCI info
    outl(PCI_CONFIG_ADDR_PORT, addr);
    return inl(PCI_CONFIG_DATA_PORT);
}
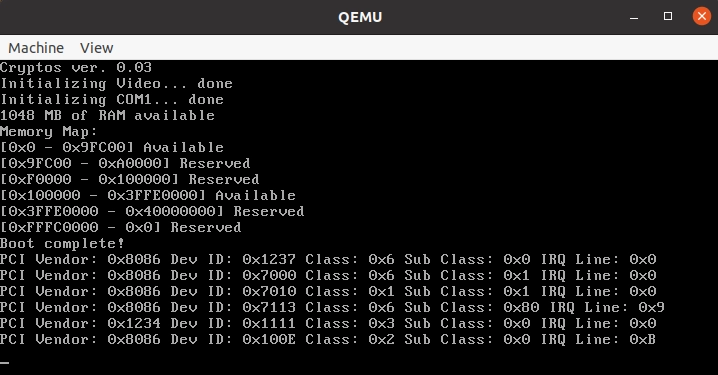
My OS enumerates the virtual PCI devices QEMU provides to the guest as shown below.

Looking back at the QEMU terminal, we can see it has detected PCI configuration reads as we expected and it matches what our OS reports!
The string formatting is as follows pci_cfg_read(const char *dev, unsigned devid, unsigned fnid, unsigned offs, unsigned val) "%s %02u:%u @0x%x -> 0x%x" (source).
pci_cfg_read i440FX 00:0 @0x0 -> 0x12378086
pci_cfg_read i440FX 00:0 @0x0 -> 0x12378086
pci_cfg_read i440FX 00:0 @0x8 -> 0x6000002
pci_cfg_read i440FX 00:0 @0x3c -> 0x0
pci_cfg_read PIIX3 01:0 @0x0 -> 0x70008086
pci_cfg_read PIIX3 01:0 @0x0 -> 0x70008086
pci_cfg_read PIIX3 01:0 @0x8 -> 0x6010000
pci_cfg_read PIIX3 01:0 @0x3c -> 0x0
pci_cfg_read piix3-ide 01:1 @0x0 -> 0x70108086
pci_cfg_read piix3-ide 01:1 @0x0 -> 0x70108086
pci_cfg_read piix3-ide 01:1 @0x8 -> 0x1018000
pci_cfg_read piix3-ide 01:1 @0x3c -> 0x0
pci_cfg_read PIIX4_PM 01:3 @0x0 -> 0x71138086
pci_cfg_read PIIX4_PM 01:3 @0x0 -> 0x71138086
pci_cfg_read PIIX4_PM 01:3 @0x8 -> 0x6800003
pci_cfg_read PIIX4_PM 01:3 @0x3c -> 0x109
pci_cfg_read VGA 02:0 @0x0 -> 0x11111234
pci_cfg_read VGA 02:0 @0x0 -> 0x11111234
pci_cfg_read VGA 02:0 @0x8 -> 0x3000002
pci_cfg_read VGA 02:0 @0x3c -> 0x0
pci_cfg_read e1000 03:0 @0x0 -> 0x100e8086
pci_cfg_read e1000 03:0 @0x0 -> 0x100e8086
pci_cfg_read e1000 03:0 @0x8 -> 0x2000003
pci_cfg_read e1000 03:0 @0x3c -> 0x10b
You can also test this using the lspci utility from a guest Linux VM running under QEMU.
DMA Block I/O
Finally, you can debug some DMA operations with the dma_blk_io trace flag. To see this in action, we can perform a disk read
which uses DMA.
The formatting is as follows:
dma_blk_io(void *dbs, void *bs, int64_t sector_num, bool to_dev) "dbs=%p bs=%p sector_num=%" PRId64 " to_dev=%d"
To trigger something predictable, we will run a dd of a 128 byte block (dd if=/dev/sdb of=out bs=128 count=1) at offset 0 and 16384.
When the first dd is run, you can see the result on line 3 (offset is 0). The second dd run corresponds to line 4.
dma_blk_io dbs=0x7f2364044cb0 bs=0x558d815ec630 offset=1364811776 to_dev=0
dma_blk_io dbs=0x7f2364048730 bs=0x558d815ec630 offset=1364844544 to_dev=0
dma_blk_io dbs=0x7f2364048730 bs=0x558d815bce00 offset=0 to_dev=0
dma_blk_io dbs=0x7f236c218600 bs=0x558d815bce00 offset=16384 to_dev=0
dma_blk_io dbs=0x7f2370663940 bs=0x558d815ec630 offset=1517211648 to_dev=0
dma_blk_io dbs=0x7f2370663940 bs=0x558d815ec630 offset=1517215744 to_dev=0
...
There’s obviously a lot of other DMA operations going on and this is likely due to background I/O operations by Ubuntu which is the guest OS in this experiment.